June 2026 proved to be a pivotal and highly volatile month, breaking the powerful risk-on momentum that global equities enjoyed during April and May. The benchmark SCP 500 Index snapped its consecutive winning streak to post its first losing month of the year, declining 1.06% from its May close of 7,580.06 to end June at 7,499.36. The tech-heavy Nasdaq Composite also stumbled as high-flying valuations faced pressure, closing at 26,213.72 (a pullback of roughly 3.2% from May’s close of 27,093.90). Conversely, the blue-chip Dow Jones Industrial Average bucked the broader market’s weakness, rising 0.26% on the final day of the month to lock in a historic record close of 52,319.20.
Despite June’s rocky consolidation, the second quarter of 2026 was historically strong. The SCP 500 and Nasdaq surged 15% and 21% respectively for the quarter, registering their strongest quarterly performance since the second quarter of 2020. For the first half of 2026, the SCP 500 finished up 9.5%, the Nasdaq gained 13.0%, and the Dow rose 8.9%, putting investors on a highly robust footing entering the second half of the year.
The core market narrative in June shifted from May’s FED leadership transition to the concrete policy actions of the Federal Reserve under newly sworn-in Chair Kevin Warsh. His first Federal Open Market Committee (FOMC) meeting in mid-June sent hawkish shockwaves through both equity and fixed income markets. At the same time, macro headwinds showed a stark divergence: U.S. inflation accelerated to a resurgent three-year high of 4.2% YoY in May, while global commodities experienced a sudden, dramatic price collapse, with Brent crude diving nearly 20% to close the month at $75.02 per barrel.
Macroeconomic Review
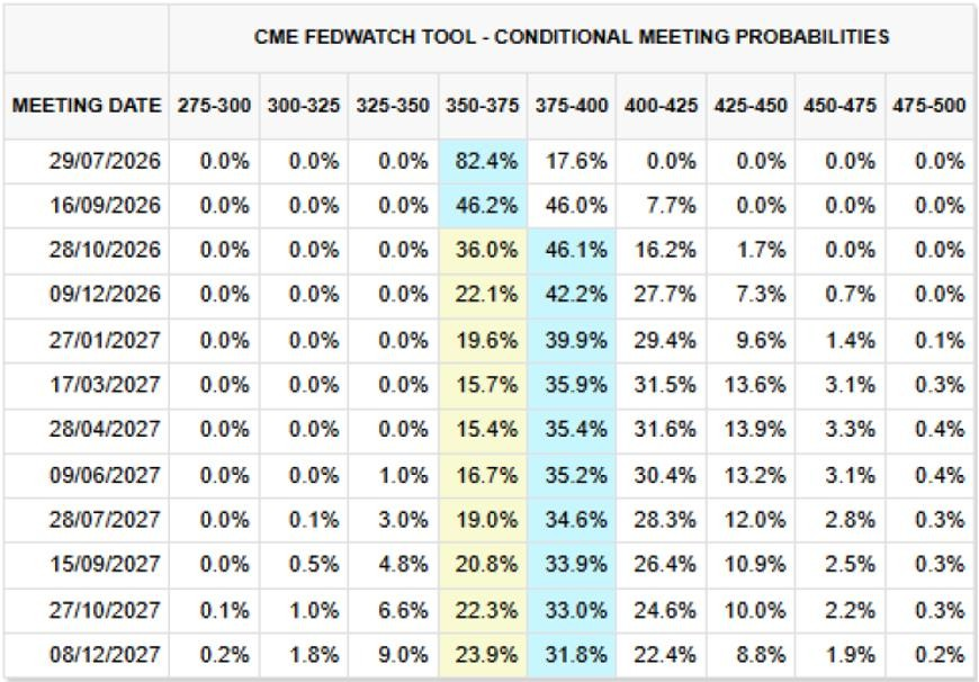
The central macroeconomic event of June 2026 was the June 16-17 FOMC meeting, marking Kevin Warsh’s debut press conference as Federal Reserve Chair. While the FOMC voted unanimously to hold interest rates steady at 3.50% to 3.75%, Warsh immediately left his hawkish and highly independent imprint on the central bank. Most notably, Warsh declined to submit his own interest rate projection for the Summary of Economic Projections (SEP) (creating a highly discussed “missing dot” in the Fed dot plot) and announced task forces to overhaul major Fed operations and inflation metrics.
The post-meeting statement was heavily stripped down, removing any forward guidance that hinted at a future easing bias. Underneath this streamlined communication, the updated quarterly projections revealed that nine of nineteen FOMC policymakers now anticipate a rate hike before the end of 2026.
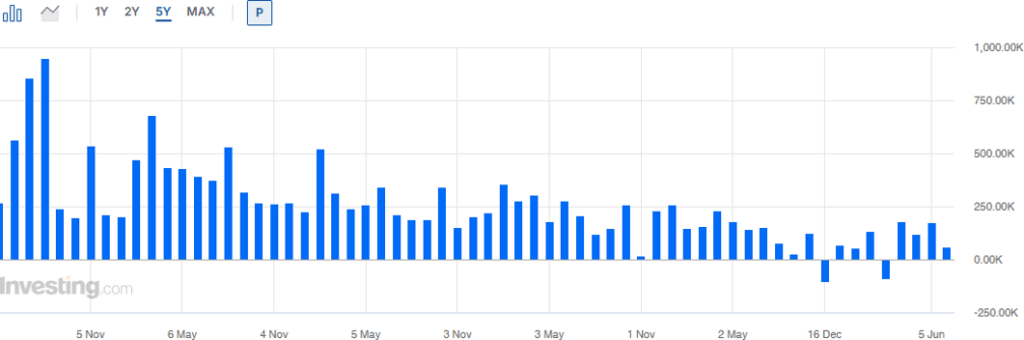
Economic data released in June underscored the immense challenges facing the new Fed Chair. Inflation data released on June 12 showed the U.S. Consumer Price Index (CPI) for May accelerating to 4.2% on an annual basis, a new three-year high driven by the compounding pass-through of energy and shipping blockages in the Middle East. In contrast, the labor market showed persistent resilience. The May employment report (released June 5) defied expectations by expanding by 172,000 non-farm payrolls, vastly beating the consensus estimate of 95,000. The national unemployment rate remained stable at 4.3%, showing a labor market tight enough to sustain persistent wage pressures.
US Non-Farm Payrolls Graph:
Key Macroeconomic Indicators (May 2026 vs. June 2026)
U.S. sovereign bonds continued to face substantial headwinds throughout June, with yields climbing to multi-year and near two-decade highs. Investors aggressively repriced the path of U.S. monetary policy to align with the hawkish posture of Fed Chair Kevin Warsh and the resurgent 4.2% headline CPI print. The benchmark 10-year Treasury yield, which had ended May near 4.41%, surged to close June at 4.58%. Short-term yields rose in tandem, with the 2-year Treasury yield climbing to 4.14%.
Corporate credit, however, continued to exhibit highly resilient, risk-on behavior. Spreads for investment-grade and high-yield corporate debt remained tightly compressed near historic lows. This pricing suggests absolute confidence in corporate balance sheets and debt-servicing power despite rising rates. However, the upward march in benchmark Treasury rates began to pressure yield-sensitive assets. Real estate investment trusts (REITs) and interest-sensitive utilities slid, with REIT indices dropping 0.6% in late June as bond income became increasingly competitive with property yields.
FOMC Rates Outlook Table:
Equity Markets
The SCP 500 closed June at 7,499.36, registering a monthly decline of 1.06% and marking its first losing month of the year. Despite this consolidation, equities wrapped up an extraordinary second quarter: the SCP 500 gained
15% and the Nasdaq surged 21% for the three months ending June 30, representing their strongest quarterly rallies since Q2 2020.
June’s moderate index pullback was characterized by a healthy sector rotation. Mega-cap technology paused as high valuations faced scrutiny and rising yields triggered institutional profit-taking. Nonetheless, fundamental demand for Artificial Intelligence infrastructure remained very strong. Strategists estimated that nearly 60% of SCP 500 earnings growth for the quarter came from AI infrastructure stocks. Broadcom, for instance, boosted the sector by raising its FY2027 AI semiconductor revenue guidance to over $100 billion, up from $56 billion targeted for the current year.
In a dramatic development, the speculative focus of the market shifted to the **Space Trade**. SpaceX filed for the largest IPO in history, targeting a valuation of at least $1.8 trillion. This historic announcement lifted a broader basket of space stocks by 57% and propelled the Procure Space ETF (UFO) up by roughly 69% in June. Meanwhile, value-oriented areas of the market flourished, leading the blue-chip Dow Jones Industrial Average to successive record highs, closing the month at 52,319.20.
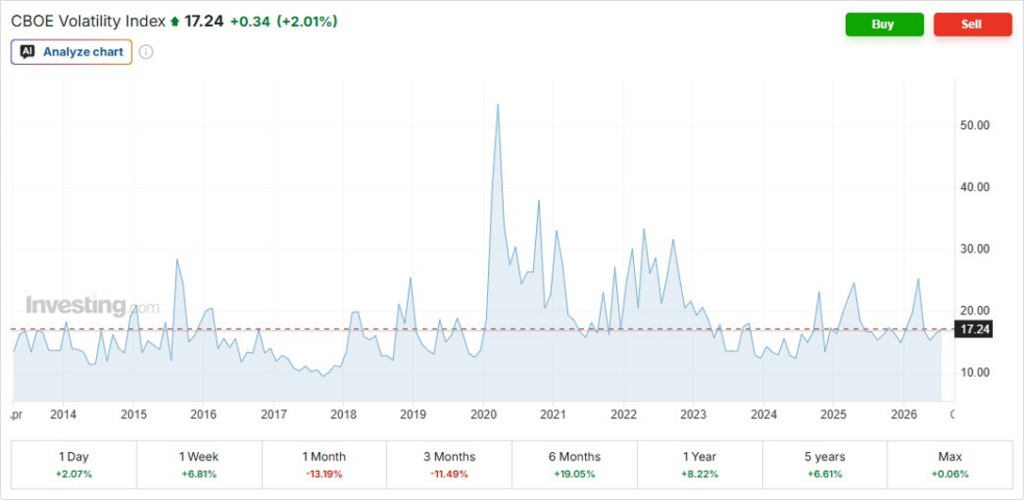
PERFORMANCE OF VIX:
Select ETF and Sector Performance Comparison (June 2026)
Sector ETF
June 2026 Return
YTD Return (1H2026)
Primary Performance Drivers
Technology (XLK)
–3.2%
+16.9%
Valuation-driven consolidation; long-term AI spend remains robust
Space Complex (UFO)
+69.0%
+85.0%
Filing of the historic $1.8 trillion SpaceX IPO
Financials (XLF)
+1.8%
+2.4%
High net interest margins and steeper curve expectations under Warsh
Real Estate (XLRE)
-0.6%
+11.4%
Pressured by rising Treasury yields competing with property yields
Energy (XLE)
–4.5%
+28.3%
Consolidated as global Brent crude prices collapsed nearly 20%
Commodities Other Asset Classes
June witnessed a dramatic trend reversal across global commodity complexes, providing a major sigh of relief for global inflation expectations.
Energy and Geopolitics
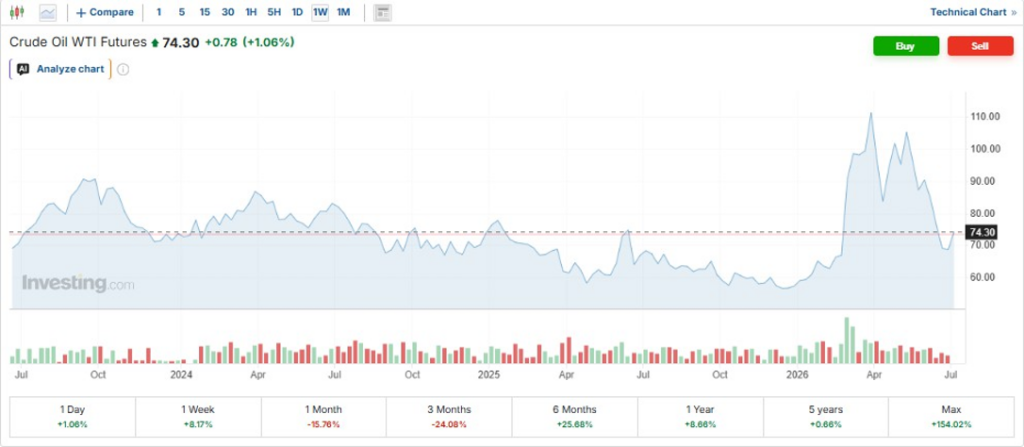
Despite the physical flow of oil remaining structurally constrained due to the ongoing closure of the Strait of Hormuz, global crude oil prices collapsed. Brent crude fell nearly 20% during the month, dropping from its high-May consolidate range of $95-$98 per barrel to close June at $75.02 per barrel. West Texas Intermediate (WTI) experienced a parallel decline, closing at $69.05 per barrel. The sudden selloff was fueled by optimistic reports of diplomatic breakthroughs and Middle East ceasefire negotiations, which significantly defused the war risk premium embedded in energy assets.
Precious Metals
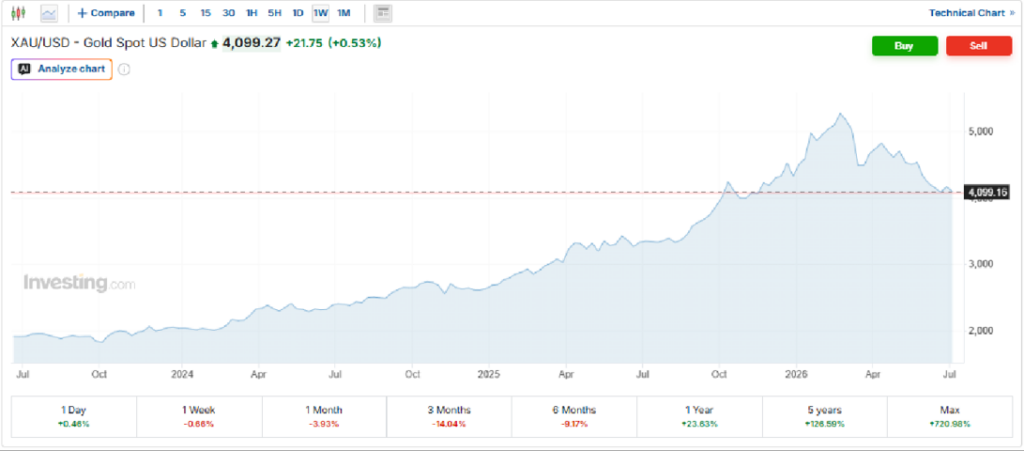
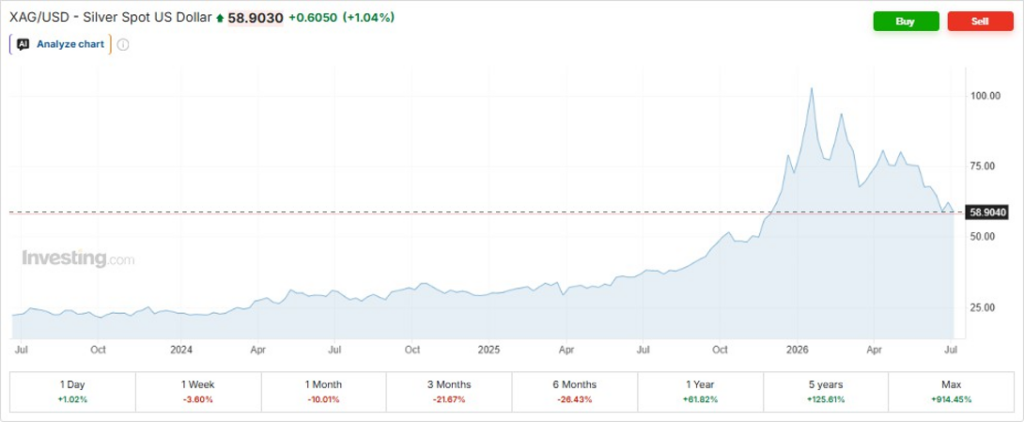
Reflecting the general easing of geopolitical tail risks and global energy pressures, precious metals also underwent a healthy consolidation. Spot gold pulled back from its historic May peak of $4,512 per ounce to close June at $4,015 per ounce. Silver closed in June at $58.43 per ounce, down from its May close of $76.67. Despite this pullback, gold remains over $700 per ounce higher than a year ago, anchored by persistent institutional hedging against public debt and currency debasement.
BRENT CRUDE OIL PRICE
GOLD PRICE
SILVER PRICE
Market Outlook’s Positioning
The market dynamics of June 2026 illustrates a structural divergence. On one side, corporate earnings remain exceptionally robust, and secular themes like the AI buildout and the space economy continue to generate historic headlines. On the other side, resurgent domestic inflation (4.2% CPI) and the hawkishness of Kevin Warsh’s Federal Reserve suggest that financial conditions will remain tight for a prolonged period.
Our core house views for entering the third quarter of 2026 emphasize a highly selective, risk-managed approach:
Cash:
We continue to recommend holding a higher-than-average cash allocation. Given the narrow breadth of the equity rally and the hawkish Fed, cash represents a vital tactical tool to exploit inevitable summer market pullbacks.
Fixed Income:
With the 10-year Treasury yield pushing to 4.58% and the 2-year yield at 4.14%, we advise against extending duration. We favor short-term Treasury bills or structured 5-to-8-year high-quality corporate ladders to lock in yield while avoiding yield curve volatility. We remain highly defensive on high-yield corporate credit.
Equities:
Investors should selectively trim positions in mega-cap technology names that have gained 20% or more over the last quarter. Reallocate these gains into defensive, cash-flow-generative compounders trading at a reasonable 12x to 15x forward P/E. Capitalize on the immense retail enthusiasm around the SpaceX IPO by taking profits in speculative space-themed proxies.
Alternatives, Precious Metals s Commodities:
We view gold’s pullback to $4,015.51 per ounce as a healthy consolidation and buy opportunity. The $4,000 support held well and represents a highly
attractive long-term accumulation zone. Private infrastructure (inflation-indexed energy systems, toll roads) remains a core alternative allocation.