July 2026 was a month defined by sharp, competing crosscurrents that tested the resilience of equity markets at historically elevated valuations. After two extraordinary quarters of gains, the SCP 500 Index entered July under mounting pressure, briefly threatening a more meaningful technical correction before finding a lifeline from a blockbuster corporate earnings report. For the month, the SCP 500 closed at 7,420.14, a decline of 1.06% from June’s close of 7,499.36. The tech-heavy Nasdaq Composite fell 1.01% to close at 25,948.37. The blue-chip Dow Jones Industrial Average proved the most resilient, closing July at 52,108.44, a modest decline of 0.40% from June.
The month unfolded in three distinct acts. First, a deepening selloff materialized as investors digested a second consecutive hawkish Federal Reserve meeting under Chair Kevin Warsh, which reinforced fears that rates may need to move higher still. Second, Alphabet’s (Google) disappointing second-quarter earnings report on July 22 struck a powerful psychological blow to the market’s mega-cap AI narrative, triggering a sharp intraday selloff and pushing the SCP 500 to its worst intraday reading of the month. Third, a dramatic reversal was engineered by Microsoft, whose outstanding Q2 results reported on July 23 reignited confidence in AI monetization and pulled markets back from the brink. Concurrently, early-stage diplomatic signals of de-escalation around the Strait of Hormuz and Iran provided an additional sigh of relief to energy markets and broader risk sentiment, preventing a more severe drawdown.
Despite the recovery, we view the episodic volatility of July as an important warning signal. Markets remain priced for perfection at these levels, and the fundamental backdrop of persistent inflation, a resolute hawkish Fed, and increasingly selective earnings quality argues strongly for caution. Gold, by contrast, demonstrated its enduring strategic value, consolidating with exceptional strength around the key $4,000 per ounce level and confirming that institutional demand for monetary hedges remains structurally intact.
Macroeconomic Review
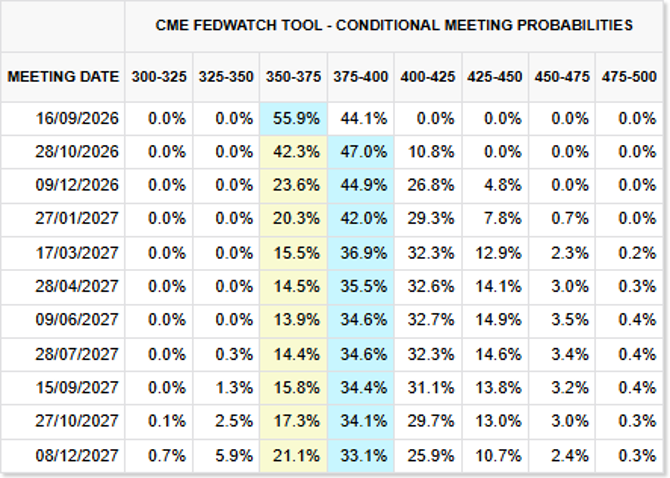
The July 29-30 FOMC meeting, the second under Chair Kevin Warsh, delivered no policy surprises but reinforced the message that the Federal Reserve’s tightening bias is firmly entrenched. The Committee voted 9-3, not unanimously, to hold the Federal Funds Rate at 3.50% to 3.75%. Warsh characterized the debate as a “good family fight,” suggesting the deliberations were serious and substantive, not an afterthought. The divide underscores real tension within the Fed about whether rate hikes should begin to combat inflation pressures. Warsh reiterated that the Fed’s primary mandate is price stability, and that financial markets must not assume the central bank will act as a backstop for elevated equity valuations.
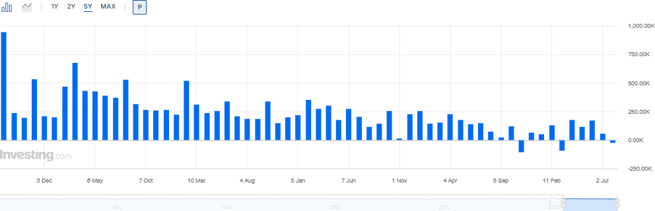
Inflation data released during July offered a modestly encouraging, though not conclusive, picture. The June CPI reading, released July 11, showed headline inflation easing marginally to 4.0% YoY from May’s three-year high of 4.2%. While the deceleration was welcome, it remains nearly double the Fed’s 2% target, and Warsh was explicit that one month’s data does not constitute a trend. Core CPI, stripping out food and energy, remained stickier at 3.6% YoY, underpinned by elevated shelter costs and resilient services inflation. The labor market continued to defy gravity: June nonfarm payrolls (released July 3) came in at 158,000, modestly above the consensus estimate of 130,000, and the unemployment rate edged marginally higher to 4.4%, suggesting a very gradual and orderly cooling rather than any hard-landing signal.
International growth signals were mixed. The Eurozone GDP growth print for Q2 2026 came in at 0.3% QoQ, an improvement from a near-stagnant Q1, but far from robust enough to trigger tightening by the European Central Bank. China’s economy continued to show divergent readings: export growth remained resilient on a weakened yuan, but domestic consumption indicators (retail sales and property investment) continued to disappoint, reinforcing fears of a protracted structural slowdown. Emerging market currencies came under moderate pressure as the U.S. dollar index firmed on the back of ongoing Fed hawkishness.
US Non-Farm Payrolls Graph:
Key Macroeconomic Indicators (May 2026 vs. June 2026)
Unchanged; stabilized at structural neutral levels
Average Hourly Earnings (YoY)
3.6%
3.6% (Est.)
Off peak levels, but remains a persistent core concern
Fixed Income
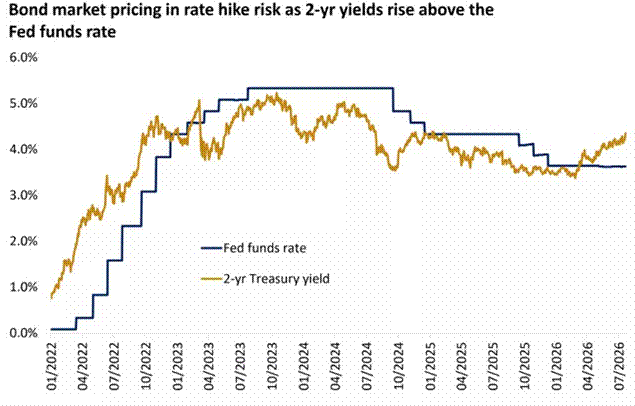
The bond market endured another uncomfortable month in July as Treasury yields marched higher across the curve. The benchmark 10-year U.S. Treasury yield rose from 4.48% at the end of June to close July at 4.75%, its highest closing level since the pre-financial crisis era of 2007. The 2-year Treasury yield climbed from 4.13% to 4.22%, as money markets continued to price out any residual prospect of near-term rate cuts. The 30-year bond yield also rose meaningfully, closing at 4.90%, putting it within sight of the psychologically significant 5.27% threshold.The yield curve continued its gradual bear-steepening, as long-end yields rose faster than short-end yields. This is a significant development: bear steepness historically presage a period of sustained financial tightening and are associated with rising sovereign risk premia, particularly relevant given the ongoing expansion of U.S. fiscal deficits. The U.S. Treasury auctioned record quantities of long-dated bonds in July, and demand from foreign central banks and sovereign wealth funds showed early signs of softening at the margins, a dynamic worth monitoring closely in coming months.
Investment-grade corporate credit spreads held broadly stable in July, with the option-adjusted spread on the Bloomberg U.S. Aggregate Corporate Index remaining near historically tight levels around 95 basis points. However, the absolute yield on investment-grade credit rose in lockstep with Treasuries, making new issuance increasingly expensive for corporates. High-yield spreads widened modestly by approximately 25 basis points during the peak equity-volatility window around the Google earnings miss, before partially retracing. This spread behavior warrants attention: high-yield credit historically leads equity markets into stress, and any further widening would be a material risk signal.
FOMC Rates Outlook Table:
Fixed Income Positioning and Recommendations
The repricing of U.S. Treasuries to multi-year highs is beginning to create genuinely attractive entry points across select fixed income segments, provided investors exercise discipline around duration and credit quality. Our key recommendations are as follows:
Fixed Income Positioning Summary (July 2026)
Segment
Recommendation
Rationale
Key Risk
U.S. T-Bills (3-6 Month)
OVERWEIGHT
Yielding ~5.15%; near risk-free with maximum flexibility in an uncertain rate environment
Reinvestment risk if rates peak sooner than expected
U.S.Treasuries(5-7Year)
SELECTIVELYADD
Attractive real yield entry point; 5- year at ~4.55% captures rate
Further bear steepening if fiscal concerns deepen
normalization without excessive duration risk
U.S. Treasuries (10-30 Year)
AVOID /UNDERWEIGHT
Significant duration risk; bear steepening and record supply make long bonds vulnerable; 30- year approaching 5%
Fiscal premium risk; softening foreign demand at auctions
IG Corporate Bonds (5-8 Year)
OVERWEIGHT
All-in yields of 5.5-6.5% for AA/A-rated corporates represent compelling income with manageable credit risk
Spread widening if equity volatility accelerates
High-Yield Corporate
UNDERWEIGHT
Spreads near historic lows do not adequately compensate for default risk in a higher-for-longer rate environment
Refinancing cliff risk as leveraged issuers face significantly higher borrowing costs in 2027
TIPS (Treasury Inflation-Protected)
SELECTIVELYADD
Real yields on 5-year TIPS near 2.2%; attractive hedge if CPI reacceleration risk materialises in H2 2026
Negative returns if inflation normalizes faster than priced
EM Sovereign Bonds (USD)
UNDERWEIGHT
USD strength and hawkish Fed pressure EM currencies; spread compression leaves little margin for error
Dollar appreciation cycle; geopolitical risk contagion
Equity Markets
The S&P 500 closed July at 7,420.14, declining 1.06% from June’s 7,499.36. While the headline loss appears modest, this number conceals a market that came significantly closer to a real technical breakdown before being rescued by a single earnings report. The month-end close masks an intraday low of approximately 7,230 registered in the days following the Google earnings miss, representing a near 3.6% intraday peak-to-trough drawdown at the worst point of the month. We regard this episode as a meaningful warning shot, not a footnote.
The July 22 earnings release from Alphabet (Google) proved to be the month’s most significant single catalyst for the downside. The company reported Q2 revenues that missed consensus expectations by approximately 2.3%, with weaker-than-anticipated performance in its core Search advertising segment and a notable slowdown in the growth trajectory of Google Cloud. More troublingly, management commentary around AI monetisation timelines was interpreted by the market as incrementally more cautious than anticipated, calling into question the near-term ROI of the enormous AI capital expenditure cycle. Alphabet shares fell 9.1% in aftermarket trading on the day, pulling the Nasdaq composite sharply lower and triggering stop-loss selling across the broader tech complex.
The recovery was then equally dramatic. Microsoft reported its own Q2 2026 results the following evening, July 23, and comprehensively beat expectations on every major metric. Azure cloud revenue grew 42% YoY,
ahead of the 37% consensus, driven primarily by surging AI service adoption including Microsoft Copilot subscriptions across enterprise clients. Microsoft shares surged 7.8% in aftermarket trading and opened significantly higher, pulling the Nasdaq and S&P 500 back from their intraday lows. The Microsoft report re-established the critical narrative that AI monetization is real, measurable, and accelerating, at least for the dominant hyperscale platforms.
Downside Risk Assessment: Markets Remain Priced for Perfection
Notwithstanding Microsoft’s rescue, we maintain a strong cautionary stance on equity markets at current levels and urge clients to resist the temptation to interpret the July recovery as a clean all-clear signal. The fundamental risk-reward at these levels is, in our assessment, deeply asymmetric to the downside for the following reasons:
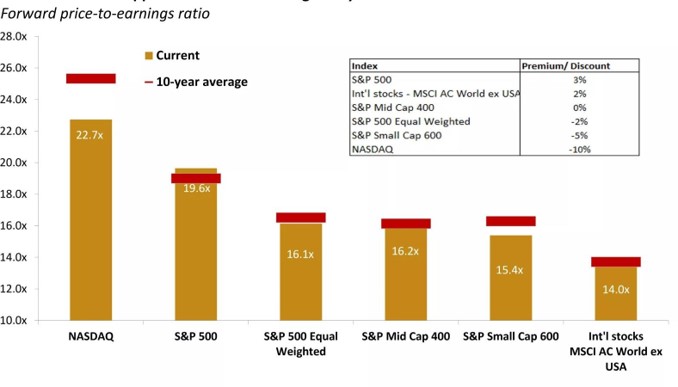
Valuation risk is extreme. The S&P 500 is trading at approximately 24x forward earnings, nearly two standard deviations above its 20-year median of approximately 16-17x. At this multiple, any disappointment in earnings, guidance, or macro data results in outsized de-rating moves. The Google episode illustrated exactly this dynamic. With the bulk of Q2 reporting now behind us, the next major earnings catalyst is not until October, leaving a long window of vulnerability.
While historical P/E ratios may appear attractive relative to long-term averages, this ostensible valuation relief is largely illusory, as it depends entirely on projected earnings that remain vulnerable to material downward revision. The fundamental risk-reward at these levels is, in our assessment, deeply asymmetric to the downside for the following reasons.
Monetary policy remains the dominant headwind. With the 10-year Treasury yield at 4.72% and T-bills yielding above 5%, the opportunity cost of equities has risen substantially. The so-called “equity risk premium” (the excess return equities offer over risk-free rates) has compressed to near zero on some measures, the lowest since the peak of the dot-com bubble. This is not stable equilibrium.
Earnings breadth is narrowing dangerously. The sustained outperformance of a handful of mega-cap names continues to mask weakness in the broader market. The equal-weighted S&P 500 has significantly underperformed its market-cap weighted counterpart year-to-date, and below the headline indices, a growing number of small and mid-cap companies are issuing cautious guidance citing input cost pressures, declining consumer discretionary spending, and tighter credit conditions.
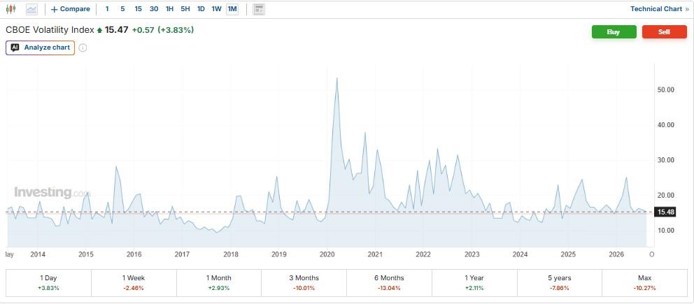
Technical deterioration is building. The S&P 500’s failure to recapture its pre-Google selloff highs before month-end, combined with declining market breadth as measured by the NYSE advance/decline line and a persistently elevated VIX (closing July above 18), are consistent with distribution patterns that historically precede more meaningful corrections. The 50-day moving average of the S&P 500 is now providing
resistance, not support. We would not be surprised by a test of the 7,100-7,200 level in the coming weeks if macro data disappoints or geopolitical tensions re-escalate.
PERFORMANCE OF VIX
Select Index and Sector Performance (July 2026)
Sector / Index
July 2026 Return
YTD Return (2026)
Primary PerformanceDrivers
S&P 500 (SPX)
-1.06%
+8.4%
Hawkish Fed + Google miss offset by Microsoft beat; breadth continues to deteriorate
Nasdaq Composite (IXIC)
-1.01%
+11.9%
GOOG dragged index; MSFT and AI semiconductor names partially recovered losses
Dow Jones (DJIA)
-0.40%
+8.5%
Defensive names and Financials provided relative resilience
Technology (XLK)
–2.1%
+14.5%
Google earnings miss sparked sector-wide derating; MSFT partially clawed back losses
Healthcare (XLV)
+2.3%
+6.1%
Classic defensive rotation; investors sought lower-beta quality during tech turmoil
Sharp spike to intraday high of 24.6 post-Google earnings; structurally elevated vs. H1 2026
Commodities Other Asset Classes
Energy and Geopolitics
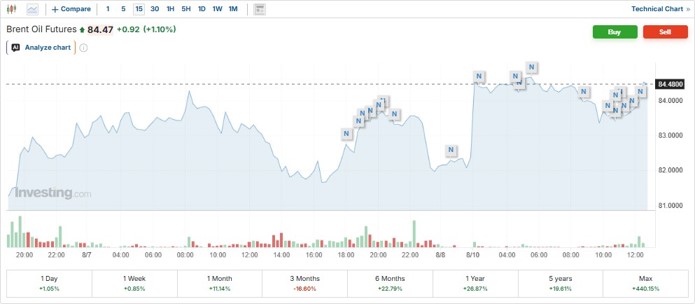
Brent crude oil closed July at $73.40 per barrel, broadly stable from June’s close of $75.02, oscillating in a
$70-$77 trading range throughout the month. WTI closed at $68.85. The most important development in energy markets was not price direction but geopolitical trajectory: diplomatic communications between U.S., European, and Gulf intermediaries relating to Iran and the Strait of Hormuz produced cautiously optimistic signals mid-month. While the Strait formally remained constrained, shipping insurance premia declined modestly, and VLCC freight rates eased from their June peaks, suggesting the market is beginning to price a non-zero probability of a partial reopening. Any confirmed progress on Hormuz would represent a significant deflationary impulse for both energy and global goods inflation and would be immediately positive for risk
assets broadly. We are watching this very closely as the single most important geopolitical variable for Q3 2026 market outcomes.
OPEC+ held its scheduled meeting in late July and maintained current production quotas, declining to accelerate supply increases despite calls from major consuming nations. Saudi Arabia signaled comfort with Brent in the $70-$80 range, viewing this as sufficient to fund sovereign spending without triggering demand destruction. We expect energy prices to remain range-bound in the near term, with the Hormuz situation representing the primary swing factor in either direction.
Precious Metals: Gold Consolidation at $4,000 is Highly Constructive
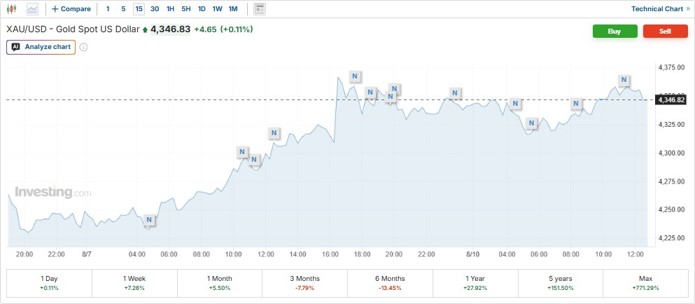
Gold was undoubtedly the standout performer on a risk-adjusted basis in July, and we view its behavior as deeply instructive. Spot gold closed July at $4,038 per ounce, effectively holding the $4,000 level as a floor throughout the month despite headwinds from a modestly stronger U.S. Dollar Index and continued upward pressure on real yields, both of which would historically be expected to weigh on gold prices. The fact that gold is holding above $4,000 in the face of these traditionally negative forces speaks volumes about the depth and structural nature of institutional demand.
The technical picture for gold is exceptionally constructive. The $3,950-$4,000 zone has now been tested multiple times and has held on each occasion, building a very strong base. The 50-day and 200-day moving averages remain in a firmly bullish alignment, and long positioning among institutional accounts per CFTC Commitment of Traders data remains elevated but not at extremes. We view any dip toward $3,950-$4,000 as a high-conviction accumulation opportunity. Central bank buying from EM central banks (notably China, India, Turkey, and Poland) remains a structurally persistent bid that has fundamentally altered gold’s supply-demand dynamics. Silver closed July at $58.80 per ounce, modestly higher than June’s close of $58.43, and continues to trade at historically wide discounts to gold on a ratio basis, representing potential upside if industrial demand recovers.
Industrial Metals and Agricultural Commodities
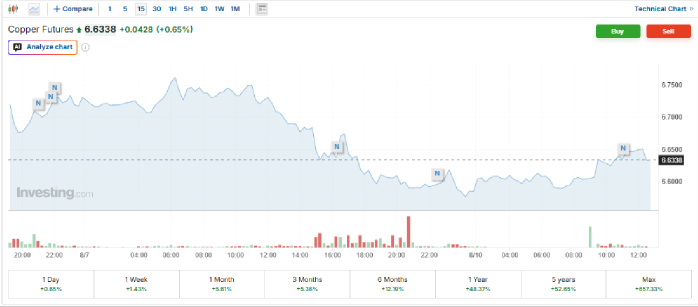
Copper continued to face pressure in July, closing at approximately $4.12 per pound (LME 3-month), down approximately 3.8% for the month. Weaker-than-expected Chinese manufacturing PMI data (50.1 in June, released early July) weighed on industrial metals across the board, as China remains the marginal driver of copper demand. We view copper as a key macro barometer: sustained weakness would signal genuine deterioration in global growth expectations and would be a negative signal for risk assets broadly. Agricultural commodities were broadly stable, with CBOT wheat and corn little changed, while softs (coffee, cocoa) experienced modest seasonal volatility.
BRENT Oil
GOLD PRICE
Copper Futures;
Market Outlook s Positioning
July 2026 delivered the clearest message yet that this bull market is entering a more treacherous and selective phase. The era of broadly rising tides lifting all boats is over. What has replaced it is a market defined by extreme concentration risk, where one or two earnings reports can swing indices by several percentage points in either direction. This is not a healthy market structure, and we believe it argues strongly for a more defensive and disciplined positioning heading into the final five months of the year.
Our core house views for the remainder of Q3 2026 emphasize capital preservation, income generation, and selective accumulation in assets with strong fundamental underpinning:
Cash:
Maintain a higher-than-average cash allocation. With T-bills yielding above 5%, cash is no longer dead money. It provides optionality to deploy into equities at materially better levels and represents genuine positive real yield in this environment. We target a cash allocation of 15-20% of total portfolio for risk-aware investors.
Fixed Income:
Increase exposure to short-to-medium duration high-quality fixed income. T-bills (3-6 month) and 5-7 year investment-grade corporate ladders offering all-in yields of 5.5-6.5% represent compelling risk-adjusted income. TIPS deserve a strategic allocation as a hedge against renewed CPI acceleration. Maintain avoidance of long-duration Treasuries
and high-yield credit until spread adequately compensate for cycle risk. Target a meaningful 25-35% total fixed income weighing for balanced mandates.
Equities:
Reduce broad beta exposure and focus ruthlessly on quality. Trim mega-cap technology names that have gained 15% or more year-to-date and have not yet delivered meaningful AI revenue. Rotate proceeds into defensive, cash-flow-generative compounders (Healthcare, Consumer Staples, Quality Industrials) at 12-15x forward earnings. Financials merit a modest overweight, as rising rates directly support net interest margins and bank capital ratios remain robust. Resist the temptation to add to Consumer Discretionary or high-multiple growth names at these levels. A correction of 7-12% in the S&P 500 from current levels remains firmly within our base case range for Q3, and investors should be psychologically and financially prepared for it rather than waiting to react.
Gold and Precious Metals:
Gold is our highest-conviction long position heading into August. The $4,000 per ounce level has proven its significance as structural support. We recommend actively accumulating physical gold, gold ETFs (GLD, PHGP), and high-quality gold royalty companies on any pullback toward
$3,950-$4,000. Our 12-month price target for gold is $4,350-$4,500, underpinned by persistent EM central bank demand, continued U.S. fiscal expansion, rising geopolitical fragmentation, and the secular trend away from USD-denominated reserve assets. Silver warrants a satellite position given its historically wide discount to gold and long-term industrial demand tailwinds from the energy transition.
Commodities Broadly:
Maintain a selective and tactical approach. Oil is range-bound with asymmetric Hormuz optionality; position accordingly with modest long exposure via ETFs rather than concentrated bets. Reduce copper exposure until China growth signals improve. Agricultural commodities remain a useful diversifier and inflation hedge, particularly for clients seeking real-asset exposure outside of precious metals and real estate.
Private and Real Assets:
Inflation-linked infrastructure (toll roads, regulated utilities, LNG terminals) remains a core allocation for clients with longer investment horizons and illiquidity tolerance. These assets provide genuine inflation pass-through that bonds alone cannot replicate in a higher-for-longer environment. Real estate deserves continued underweight in rate-sensitive geographies, though select logistics, data centre, and industrial REITs with pricing power and long-term lease structures retain strategic merit.