May 2026 sustained the powerful risk-on momentum established in April, with global equity markets logging historic milestones. The benchmark SCP 500 Index closed the month at a record high of 7,580.06 on Friday, May 29, representing a solid 5.2% monthly advance. This gain capped a remarkable nine-week consecutive winning streak, the longest weekly run for the index since 2023. The rally was underpinned by dual engines: persistent, aggressive capital expenditure on artificial intelligence infrastructure ⁴ and continued market optimism surrounding tentative ceasefire negotiations in the Middle East. The blue-chip Dow Jones Industrial Average also set a historic milestone, closing above 51,000 for the first time in history.
However, beneath the surface of record equity highs, macro headwinds and inflation pressures continued to build. The defining event of the month occurred on May 22, 2026, when Kevin Warsh was officially sworn in as the new Chair of the Federal Reserve Board of Governors, succeeding Jerome Powell. As a notable hawk, Warsh takes the helm at a highly sensitive juncture. Fresh economic data released in May showed overall annual CPI inflation accelerating to 3.8%, a three-year high driven by the lingering impacts of the spring oil shock and the ongoing closure of the Strait of Hormuz. Fixed income markets remained under visible pressure, with the 10-year U.S. Treasury yield hovering in the 4.40% to 4.45% range as investors repriced the “higher-for-longer” monetary landscape under the new Fed regime. Meanwhile, commodities experienced diverging paths: Brent crude consolidated in the $95 to $98 per barrel range, while gold surged to new historic heights, stabilizing between $4,450 and $4,550 per ounce as institutional portfolios sought refuge from structural inflation and currency debasement.
Macroeconomic Review
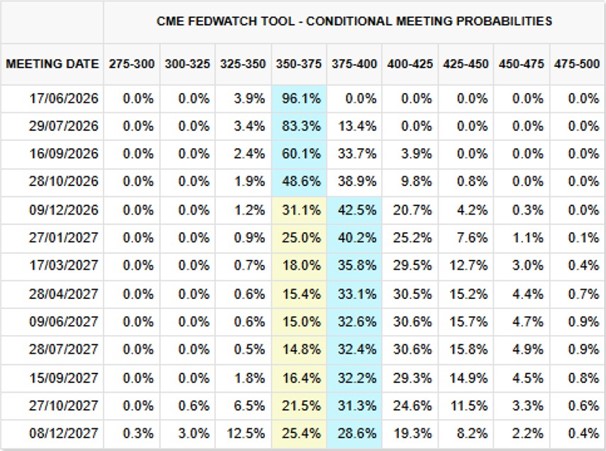
The central event of May 2026 was the official transition of leadership at the Federal Reserve. Following a party-line confirmation vote of 54–45 in the Senate on May 13, Kevin Warsh was sworn in as the new Federal Reserve Chair on Friday, May 22. Warsh’s arrival marks a potential shift in the Fed’s playbook. Historically characterized as a policy hawk, his initial commentary focused heavily on the need to manage the “bloated” Fed balance sheet while potentially restructuring policy communication. The newly released minutes from the Fed’s April meeting highlighted that central bank staff view persistent inflation as a “salient risk”, a concern further validated by May’s data releases. Though the Fed did not hold a policy meeting in May, interest rate futures indicate that the market expects policy rates to remain steady at 3.50% to 3.75% for the foreseeable future, as Warsh balances domestic political pressures against resurgent inflation pressures.
Inflation data released on May 12, 2026, underscored the scale of the challenge facing the incoming Fed Chair. The Consumer Price Index (CPI) for April rose 3.8% on an annual basis, up sharply from 3.4% in prior months. Crucially, core CPI (excluding food and energy) rose 0.4% month-over-month, marking the sharpest monthly acceleration since January 2025. The primary culprit was the pass-through of elevated energy and shipping costs stemming from the blockages in the Middle East.
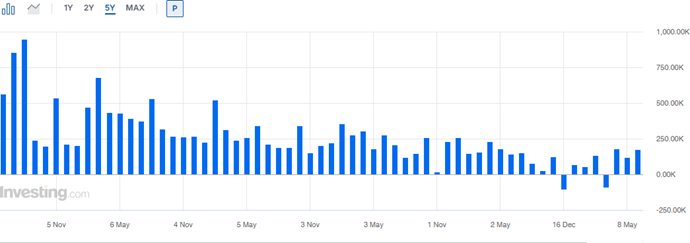
The labor market showed ongoing signs of gradual cooling, though it remains tight enough to sustain wage pressures. The April jobs report, released on May 8, showed non-farm payrolls expanding by 115,000, which handily beat the consensus forecast of 65,000. The national unemployment rate held steady at 4.3%. Wage growth moderated slightly to 0.2% monthly and 3.6% annually, providing a rare piece of cooling data for policymakers. As of late May, the consensus projection for the upcoming May employment report (scheduled for release on June 5) is an expansion of 95,000 payrolls.
US Non-Farm Payrolls Graph:
Key Macroeconomic Indicators (May 2026 vs. April 2026)
Indicator
April 2026(Reported)
May 2026(Reported/Est.)
Trend / Note
Federal Funds Rate
3.50% – 3.75%
3.50% – 3.75%
Kept steady; no FOMC meetingheld in May
Headline CPI (YoY)
3.4%
3.8%
Accelerated to a 3-year high onenergy pass-through ⁶
Core CPI (MoM)
0.2%
0.4%
Sharpest monthly increasesince January 2025 ⁷
Nonfarm Payrolls (MoM)
115,000
G5,000 (Est.)
Gradual moderation; officialdata due June 5
Unemployment Rate
4.3%
4.3% (Est.)
Stabilized at structural neutrallevels
Average Hourly Earnings(YoY)
3.6%
3.6% (Est.)
Off peak levels, but remains apersistent core concern
Fixed Income
The SCP 500 closed the month at 7,580.06, registering a monthly return of 5.2%. The tech-heavy Nasdaq Composite also moved higher, closing near 27,093.90. The persistent rise in equities, however, concentrated heavily in megacaps technology. Market technicians noted a widening divergence: while major indices repeatedly achieved records, only 60% of SCP 500 constituents traded above their 200-day moving average, signaling high market concentration and structural fragility.
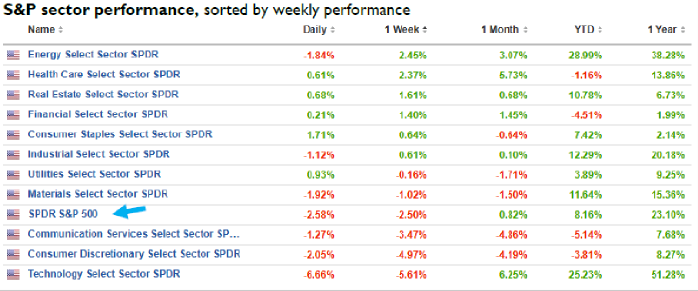
Sector performance was led by Information Technology and Financials. Tech was buoyed by outstanding earnings reports and bullish forward guidance from market leaders, including Dell and Nvidia, which highlighted the insatiable demand for AI enterprise hardware. Financials also found strong support, benefiting from high net interest margins under a higher-for-longer rate environment and market expectations of regulatory relief under the incoming Fed leadership. Energy stabilized after a volatile April, supported by crude prices holding near structural highs.
FOMC Rates Outlook Table:
Equity Markets
pril delivered one of the strongest equity rallies of 2026, reversing March’s losses and reaching new all-time highs across major indices. The SCP 500 gained approximately 10.5%, while the Nasdaq Composite soared roughly 15.6%, driven by a powerful rotation back into large-cap technology and AI-related companies. Growth equities, which had borne the brunt of March’s sell-off, captured approximately 12.4% in total returns versus just 7.2% for value strategies, signaling a decisive shift in investor sentiment toward companies leveraged to the artificial intelligence investment cycle.
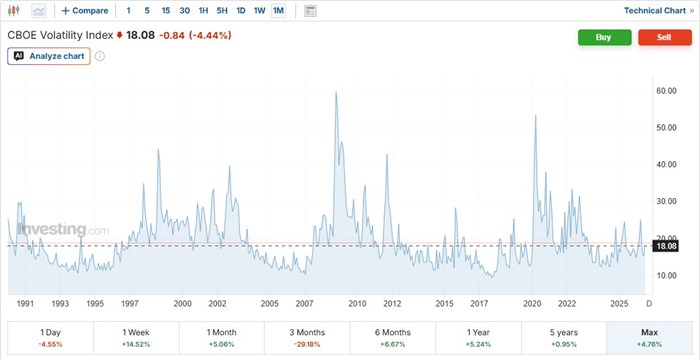
PERFORMANCE OF VIX:
Geopolitical risk forced a rapid reassessment among equity investors. Escalating rhetoric and infrastructure threats between the U.S. and Iran sent shockwaves through the market, ending the steady complacency that had characterized the winter months. Defensive sectors and Energy producers saw pockets of strength, while Software, Logistics, and Real Estate faced sharp drawdowns amid fears of disruption and a higher-for-longer interest rate regime.
MONTHLY SECTOR PERFOMANCE
Select Sector SPDR
May 2026 Return(Est.)
YTD Return (as ofMay 31)
Primary Performance Drivers
Technology (XLK)
+7.4%
+20.1%
AI capital expenditure surge, NVDA C Dell earnings ⁴¹³
Defensive allocation and resilient domestic pricing power
Energy (XLE)
+1.2%
+32.8%
Resilient cash flows as Brent holds near $97/bbl ¹¹¹²
Utilities (XLU)
+0.5%
+9.5%
Flat performance as high yields cap income appeal
Health Care (XLV)
-0.8%
-7.0%
Ongoing rotation into cyclical and growth strategies
Commodities Other Asset Classes
Energy and Geopolitics
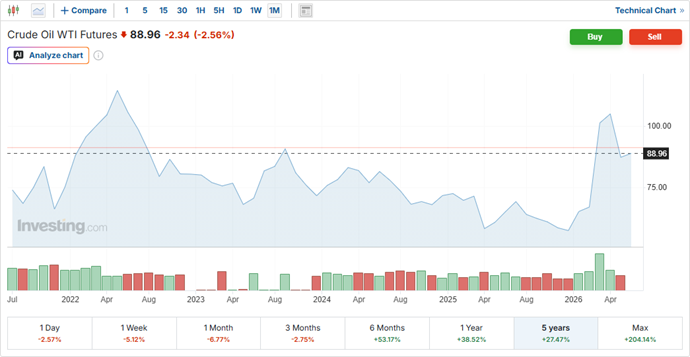
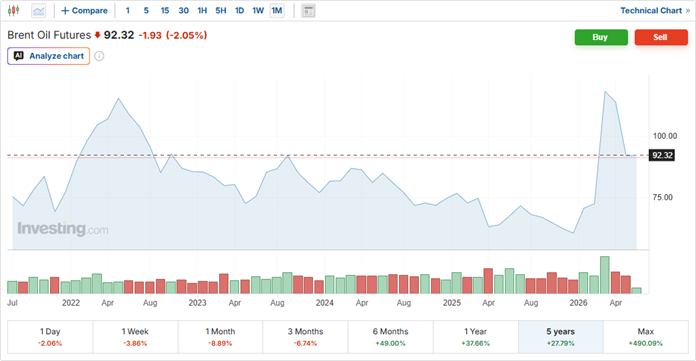
Despite tentative peace rumors in the Levant and U.S.-Iran diplomatic backchannels, the physical flow of oil remained constrained due to the prolonged closure of the Strait of Hormuz. Brent crude oil prices consolidated their April gains, finishing May in the $95 to $98 per barrel range, while WTI crude consolidated between $89 and $92 per barrel. Analysts continue to warn that if Hormuz shipping flows do not resume ahead of the peak summer driving season, retail gasoline prices in the U.S. could threaten the $5.00 per gallon mark, presenting a direct challenge to consumer sentiment and the inflation outlook.
Precious Metals
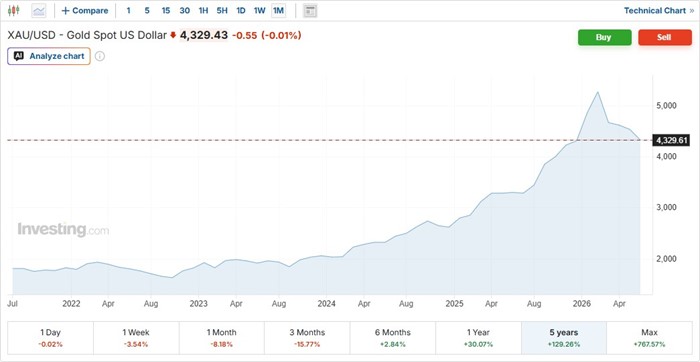
Gold was a standout performer in May, staging a major breakout above previous April levels of $4,100 to $4,200. Spot gold consolidated in the $4,450 to $4,550 range, ending May near $4,512 per ounce. Silver also surged, ending the month near $76.67 per ounce. This aggressive upward move in precious metals reflects a strong undercurrent of institutional asset allocation toward hard-asset hedges. Investors are increasingly seeking shelter from the combination of high public debt burdens, geopolitical tail risks, and the persistent threat of supply-driven inflation.
WTI Oil Price:
BRENT Crude Oil Price:
Gold Price:
Market Outlook & Positioning
The market dynamics of May 2026 illustrates a structural divergence. On one side, equity indices are reaching record highs powered by secular AI spending and strong corporate earnings. On the other side, persistent inflation, elevated commodity prices, and a major leadership transition at the Federal Reserve suggest that financial conditions will remain tight for a prolonged period. Our core house views for the transition into Q3 2026 emphasize a highly selective, risk-managed approach, with gradual reduction of exposure to equities:
Cash:
We maintain our recommendation to hold a higher allocation to cash entering the summer, lower volumes trading season. Given the narrow breadth of the equity rally, where a handful of mega-cap technology stocks are carrying the index higher, cash represents a vital tactical tool to exploit inevitable market pullbacks and structural dislocations.
Fixed Income:
Under Chair Kevin Warsh’s hawkish regime, we advise against extending duration too far. The 10-year Treasury yield near 4.41% offers a reasonable entry point, but we favor structured 5-to-8-year Treasury ladders or intermediate, investment-grade corporate credit. This positioning captures attractive carry while protecting capital from potential yield volatility. We remain very cautious about High-yield credit.
Equities:
With valuations trading at historical premiums, we advise investors to selectively trim positions in mega-cap technology names that have gained 20% or more since their spring lows. Portfolios should reallocate these gains into structured equity-linked products, such as Fixed Coupon Notes, or into high-quality defensive compounders trading at a more reasonable 12-to-15x forward P/E with high free cash flow yields. SpaceX IPO spree could likely mark the peak of mega-cap performance, being the 12th listed company in US with market cap
> $ 1 trillion.
Alternatives:
Incorporating private, uncorrelated assets is crucial in the current macro landscape. We continue to favor Infrastructure (toll roads, utilities, and green energy systems providing inflation-indexed cash flows), and Selective Real Estate (focusing on industrial logistics and well-capitalized multifamily properties while avoiding office and commercial).
Precious Metals & Commodities:
We maintain a strong conviction in gold as a foundational portfolio hedge. While the metal may pause after its rapid climb to $4,512 per ounce, we view any pullback toward $4,400 as an attractive buying opportunity. Oil remains range-bound within the $95 to $100 range, and portfolios should start taking profits in energy equities while closely monitoring the Strait of Hormuz.